Over at Slate, I’ve written a response to Matt Yglesias’s reply to my criticism of his ideas about piracy and copyright.
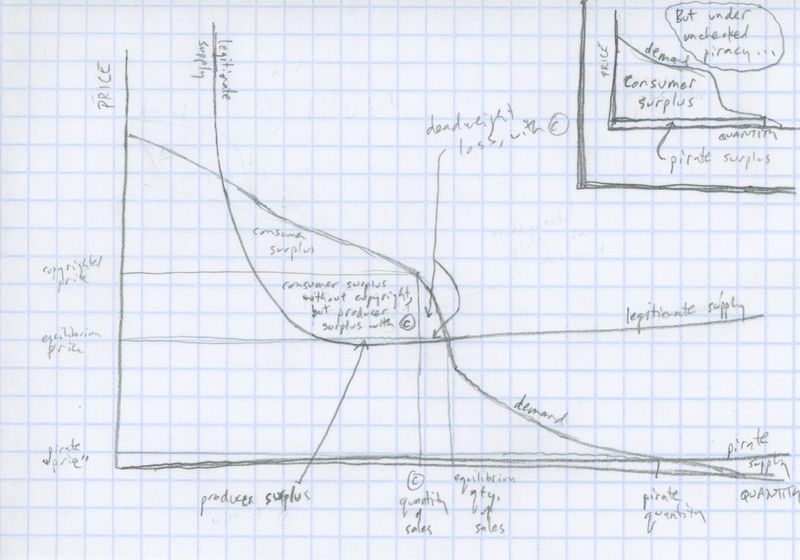
In the last paragraph of my new post, I qualify my assessment of piracy’s impact on copyright by wondering “if I’m drawing the graphs correctly.” Should anyone want to inspect those graphs, here are a couple! As I’ve said repeatedly, I’m no economist, so they could be riddled with errors. I didn’t draw the supply curve as a straight, upward-sloping line because I’ve always understood that in the book-publishing world, publishers are willing to sell books cheaper if they can sell more of them, and editors spend much time and energy trying to guess whether demand will be sufficient to justify a low price, or insufficient and require them to charge a high one. This may be an elementary error for all I know; if it is, please accept my apologies and straighten out my supply curve. If I’m right about the shape, though, it means that the surplus that a producer can rely on, even if he doesn’t have copyright protection, is just a tiny horizontal slice, lying like a pancreas under a liver, hard to see unless you click on the graph and view it full size. I drew the demand curve with a hump in it because it’s my impression that the audience for a given art work has a natural size, who won’t be deterred by a slight increase in price or much encouraged by a slight decrease. I could be wrong there, too, of course. The inset that I drew in the upper right corner, by the way, is intended to show how unimpeded piracy apportions the economic value of a work of art. As I write in my latest Slate piece, unimpeded piracy “cedes almost the whole triangle under the demand curve to consumers—transferring just a sliver along the bottom to the pirates themselves and leaving virtually nothing for legitimate publishers.”
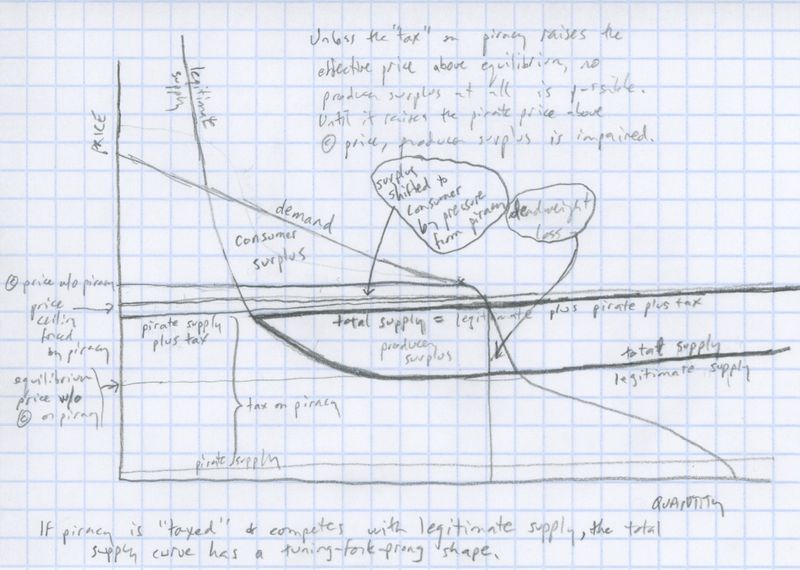
I wondered about that claim after filing my article, and found myself doodling another graph yesterday afternoon to speculate more methodically about what happens when pirated work competes with copyrighted work. It seems to me that what you need to do is see where the demand curve meets the total supply curve, which is the sum of the legitimate supply curve and the pirate supply curve. Those curves have to be added along the axis of quantity, not price, so if nothing is impeding piracy, don’t bother going any further—the little inset that I drew in the graph above is fine. If piracy is “taxed,” however, by social disapproval, legal jeopardy, or some other inconvenience, the pirate supply curve gets shifted upward along the price axis, and when you add together a taxed pirate supply curve and a legitimate supply curve, you get something that looks a little like a sideways tuning-fork prong, in darkish pencil in the graph below. A tax on pirates makes it possible for legitimate publishers to stay in the marketplace. If the tax is high enough to raise the effective price of a pirated work above the copyrighted price, the legitimate publishers lose nothing, comparatively speaking. If the effective price doesn’t rise that far but does rise above the equilibrium price that would obtain in the absence of copyright and in the absence of piracy (a somewhat notional distinction, IMHO), producers can’t get as large a surplus as they would under copyright, but they can get something. If the tax doesn’t raise the effective price of a pirated work above the notional equilibrium, however, it looks as if producers get no surplus at all.
Advisory: These graphs should be accorded no authority other than as samples of what happens when a humanities-type person tries to puzzle out an economics problem.


A good source for graph on exactly this topic :
Richar Watt, Copyright and Economic Theory: Friends or Foes?, Edward Elgar Publishing Ltd , 2000.
Thanks, Mathieu! Sorry not to have responded to the comment you left on the previous post, but my hope was that I would be able to address the concerns you raised in the new Slate piece.
First of all, your supply line doesn't make sense. The supply line indicates the producer's cost. While you're correct that the producer's marginal cost (i.e. cost per item) will decrease as the quantity goes up, your current graph indicates that the overall price for the producer goes down as the quantity increases (e.g. the total cost of making 100 books is less than the total cost of making 10 books). That's possible in some cases, but I don't think it's what you mean to show in this case.
Your second graph looks like it's getting closer, but it's hard for me to read. Google Docs Presentations allow you draw pretty easily, and might make it easier to see what you're trying to show. Here's my attempts at showing the impacts of copyright laws and piracy on the suppy and demand curves. https://docs.google.com/present/edit?id=0AYQqWFI4_hgoZGdjcTNuNG1fMThmamhiOGNkaA
(For the record, I have an undergraduate degree in agricultural economics, but I haven't drawn a supply/demand graph in the last 10 years. I'm prepared to eat my fair share of crow if I've made some sort of dumb mistake.)
You're right that marginal costs are important, but the supply line on the chart is for total cost. To the the marginal cost, you want to find the slope of the supply line (or the first derivative if you want to get your calculus on).
In a situation like mp3s where there is a steep production cost, the first unit is always the most expensive. However, in order to sell two copies, you have to spend all the costs on the first one, plus whatever marginal cost it takes for the second one.
When a graph has a negative (NW to SE) slope, you're saying that it will cost you $1,000 to make one book, $600 to make two books (or $300/book), and $450 to make 3 books ($150/book). That's what the first half of your supply line is currently indicating. What I think you're trying to say is that it will cost you $1,000 for the first book, $1,001 for the second book ($500.50/book), and $1002 for the third book ($334/book). That still gets the big drops in marginal costs, but it would look something like the supply lines in my graphs rather than the L-shaped curves in your graphs.
You're right that switching the supply curve's angles affects the producer surplus, which is a problem with your original graph. You're also right that there are cases where the pirate-driven demand decrease will eliminate the producer surplus altogether. I've added a slide which I hope will better show why.
Of course, none of this really answers the question about whether the fall in demand has prevented a potential equilibrium or whether the fall in demand simply forces the producer to lower its monopoly price. I think it's pretty clear, though, that current levels of piracy still allow producers some producer surplus (or else they'd have stopped producing movies and songs already).
-Zack S.
A FB User: Thanks for this. Your graphs are a lot easier to read than mine. It looks like you're graphing things mostly the way I am in your first three slides, except for the left end of the supply curve. I'm not sure I'm wrong about having the left tail pointing up, though. As I understand it, the supply curve plots unit price against quantity, and unit price varies according to marginal cost, not total cost. All the textbook illustrations that I can find do show purely upward-sloping supply costs, but I think that's just for the sake of simplifying the examples. You write, in your slide 1, "The supply curve is initially very steep because it costs money to create the song." But shouldn't it be steep in the other direction? In other words, if you were only going to sell one copy of the song, wouldn't you need to charge all your production costs? And if you sold two copies, half your productions for each copy? And so on. So the line would be descending parabolically from the total cost of creating the work of art and setting up the printing press (or its equivalent).
Your idea in slide 4 of shifting the demand curve is a smart one. (I had kept the demand curve the same and tried to compare it to the sum of the legitimate supply curve and a taxed pirated supply curve, but your idea is more elegant.) I think we should get the same result either way we graph it, and if I'm right about the shape of the legitimate supply curve and you flip the left tail of your supply curve from downward to upward in slide 4, then I think what you'll see in your slide is that if piracy shifts the demand curve very far to the lower left, then the whole demand curve falls entirely below the legitimate supply curve, and there's no intersection at all. (The way you've drawn the supply curve, there would always be some producer surplus no matter how great the extent of piracy, and I think intuitively that can't be the case.) Anyway, your way of drawing slide 4 is better than my second graph above. Thanks!
Hi, Zack S.,
I thought some more about the shape of the supply curve, and I think I'm going to stick to my guns. The vertical axis has to be unit price, not total price of all goods produced. Otherwise the intersection of the supply curve with the demand curve wouldn't generate a unit price, as it famously does. And unit price ought to vary according to the supplier's marginal cost.
So why is the supply curve always drawn as an upward-sloping line? After all, the cost of producing one item when you're producing very few should be quite high, only to drop once the supplier starts making sufficient quantities to take advantage of economies of scale, and then to rise again, more gradually, as the supplier exhausts resources that are ready-to-hand and has to pay more to fetch new resources. That should generate a U shape, not an upward-sloping line.
I found an explanation for the discrepancy here, in the lecture notes of an economics instructor:
The answer seems to be that no sane businessperson would produce on the downward-sloping part of the marginal-cost curve, and thus there's little need to draw it, usually. The trouble with culture industries is that it's not possible to know the demand curve for a given work of art ahead of time, and if you publish a flop, you're going to end up producing on the downward-sloping part of the marginal-cost curve anyway. In principle, then, I don't think the shape of my supply curve is wrong, especially if you're thinking about the publication of, say, a book of literary criticism. If you're publishing a mystery by an author with a proven track record of sale, on the other hand, my attention to the lefthand side of the supply curve will seem irrelevant.
It looks like in slide 5, the slide that you've added to your graphs, you've done exactly what any sane businessperson would do, and only drawn the supply curve after it's reached an economy of scale that makes sense. In principle, as your slide 5 shows, it's possible for piracy to sink demand so low that the curves won't intersect, though I agree with you that in the real world today, the situation isn't quite that dire.
Thanks again for the discussion!
Hello,
My two previous comments have been blunt. I must apologize fort that: I was at work.
The point you raise, about the uncertainties of the demand curve for cultural goods, is indeed a strong one. The thrust of economic analysis of cultural market is that no sane producer of cultural good cares about the supply curve of a single product. They all know that out of ten goods, seven will make losses, two will break even and one will recoup the cost of all the others, and more. This lies at the root of the feeling that produces just flood the market. It is no dumbing-down, just a rational strategy given the fundamentals of the market.
This discussion, however, is only remotely linked with copyrights.
If I may recommend another reference, perhaps the best starting point would be Richard Caves' Creative Industries, which is much less technical than Watt's book.
I must underline here that I marvel at seeing you trying (and managing) to grasp the economic point of view on the question. Here, in France, most people in your position simply take the stance that cultural endeavors are simple not amenable to economic analysis and sharply refuse to discuss the subject. I feel I must congratulate you for showing us that we, cultural economics, are not completely off the mark.
Coming back to the subject of copyright, I have seen several prominent authors advocate a renewable copyright regime. The idea would be that copyright would be short (publication+15years, for example), but could be renewed on a voluntary basis. The renewing would entail a fee that would be disproportional to the social loss of keeping the work out of the public domain (ie restricting its diffusion and use). The longer the work has been protected, the higher the fee. The larger the copyright payments made, the higher the fee. This would allow for long copyright if holders feel they have a use for it, while offsetting the main part of the deadweight loss.
The fees would be used to fund project that help creation of new works and diffusion and use of public domain ones.
What would you think of that ?
Hi, Mathieu,
Thanks again for writing in, and thanks for the kind words. The Richard Caves book looks very interesting (and is more affordable than the Richard Watt!).
The idea of making copyright shorter and requiring a fee for renewal, variable according to the length of the extension, does make a great deal of intuitive sense to me. It would make continued copyright protection available to people who want it badly enough, while encouraging authors and artists to donate to the commons artwork whose economic value has dwindled (and making the donation automatic for authors and artists who have stopped paying attention).
The difficulties would seem to be political: for several decades now people have had the expectation that their copyrights would last beyond their lifetimes, and some of them will get cranky if that's changed. Also, I believe there are international trade agreements in place that would punish the first country that tried to shift to a system of shorter copyright terms. Those are serious political challenges, requiring political canniness on the international as well as the national levels, but that doesn't mean it couldn't happen. My hunch is that in order to "sell" the idea politically, a politician would need to offer something to artists and publishers in return, and it seems to me that a reasonable bargain might be stronger copyright enforcement in exchange for shorter copyright lengths.
Hello,
You are indeed right with regard to the difficulty to market any kind of copyright lenghtening. A growing awareness of the discrepancy between the share of authors and that of publishers may help turn at least some authors around.
Apart from economic, the case against the current copyright regime is increasingly made by law scholars. Their argument is that current legislation gives pre-eminence to copyright over freedom of speech and other Consitution-guaranteed rights.